Welcome to IgMin Research – an Open Access journal uniting Biology, Medicine, and Engineering. We’re dedicated to advancing global knowledge and fostering collaboration across scientific fields.
At IgMin Research, we bridge the frontiers of Biology, Medicine, and Engineering to foster interdisciplinary innovation. Our expanded scope now embraces a wide spectrum of scientific disciplines, empowering global researchers to explore, contribute, and collaborate through open access.
Welcome to IgMin, a leading platform dedicated to enhancing knowledge dissemination and professional growth across multiple fields of science, technology, and the humanities. We believe in the power of open access, collaboration, and innovation. Our goal is to provide individuals and organizations with the tools they need to succeed in the global knowledge economy.
IgMin Publications Inc., Suite 102, West Hartford, CT - 06110, USA
The discovery of novel functional materials is frequently accelerated by machine learning (ML) techniques that visualize vast chemical spaces in low-dimensional projections. However, projecting high-dimensional materials data into a fixed 2D space can introduce significant distortions, hindering the reliable identification of new candidates. In this work, we present a robust statistical framework for unsupervised materials discovery that mitigates these challenges. Our methodology combines Principal Component Analysis with information criteria to determine the optimal dimensionality for representing a given material's dataset, thereby minimizing information loss. We apply this approach to a library of thousands of Li-based compounds, described by their chemical and structural features. Following dimensionality reduction to the statistically optimal space, we employ a non-linear unsupervised learning algorithm to identify novel materials in proximity to a user-defined reference compound. The efficacy of our methodology is demonstrated by its ability to identify candidate materials that have been experimentally reported to exhibit properties similar to the chosen reference, validating our approach as a more reliable pipeline for accelerated materials discovery.
The development of all-solid-state lithium-ion batteries is critical for next-generation technologies such as electric vehicles, grid-scale photovoltaic systems, and portable electronics. Li-based compounds are promising candidates for solid-state electrolytes and cathode materials, but their widespread adoption is hindered by significant material science challenges. These include poor ionic conductivity, electrochemical instability, and performance degradation arising from phase transitions and volumetric expansion during cycling [11Kim HJ, Krishna TNV, Zeb K, Rajangam V, Gopi CVVM, Sambasivam S, Raghavendra KVG, Obaidat IM. A comprehensive review of Li-ion battery materials and their recycling techniques. Electronics (Basel). 2020 Jul.]. Consequently, the discovery of novel lithium compounds with enhanced stability and performance remains a paramount objective in materials science.
Traditionally, the search for new materials has relied on a combination of experimental synthesis and first-principles computational methods like Density Functional Theory (DFT) [22Kim S, Hegde VI, Yao Z, Lu Z, Amsler M, He J, Hao S, Croy JR, Lee E, Thackeray MM, Wolverton C. First principles study of lithium cobalt spinel oxides: correlating structure and electrochemistry. ACS Appl Mater Interfaces. 2018;10:13479‑13490.]. While DFT provides fundamental insights into the electronic structure and properties of crystalline materials, it is computationally prohibitive for high-throughput screening of vast chemical spaces. As has been demonstrated, machine learning (ML) models can predict material properties orders of magnitude faster than DFT calculations, offering a powerful paradigm to accelerate materials discovery [33Weston L, Stampfl C. Machine learning the band gap properties of kesterite I2‑II‑IV‑V4 quaternary compounds for photovoltaics applications. Phys Rev Mater. 2018;2:085407.,44Ward L, et al. Matminer: an open‑source toolkit for materials data mining. Comput Mater Sci. 2018;152:60‑69.].
This work explores an alternative approach, leveraging unsupervised machine learning to navigate the vast landscape of inorganic materials for novel discovery. A central challenge in this domain is the visualization and exploration of high-dimensional materials data. Typically, materials are represented as high-dimensional vectors ("featured"), which are then projected into a low-dimensional space (e.g., 2D) for visualization and analysis. However, this dimensionality reduction process can introduce significant information loss and project dissimilar materials into proximity, or vice versa. Such distortions can mislead the search for novel candidates around a known material of interest. Furthermore, the motivation of this research work is to search for potential as well as novel materials around user-defined materials in both the featurized high-dimensional space and reduced dimensions, and minimize the mismatch between the materials of the featurized high-dimensional space and the reduced dimensions. Such a mismatch could occur for the following reasons. As the dataset gets larger, it becomes heterogeneous, and the projection of higher dimensions into lower dimensions could be inadequate. In N-dimensional space, 2 N-1 diagonals exist, and data points close to the diagonals get projected onto the origin, and might not be visible in lower dimensional space [55Wegman E. Lecture notes: geometric methods in statistics. Fairfax (VA): George Mason Univ; 2016.]. Also, in a higher-dimensional sphere, most data points exist on the surface [55Wegman E. Lecture notes: geometric methods in statistics. Fairfax (VA): George Mason Univ; 2016.]. In general, to visualize materials, 2-dimensional mappings of materials have been utilized [66Chen B, et al. Mapping materials and molecules. Acc Chem Res. 2020;53:1981‑1991.], which can result in loss of information due to mismatch. The primary objective of this research is, therefore, to develop and implement a methodology that minimizes the mismatch between the high-dimensional featurized space and its low-dimensional representation. By doing so, we aim to enable a more accurate and efficient search for novel, potential Li-based materials near a user-defined reference compound.
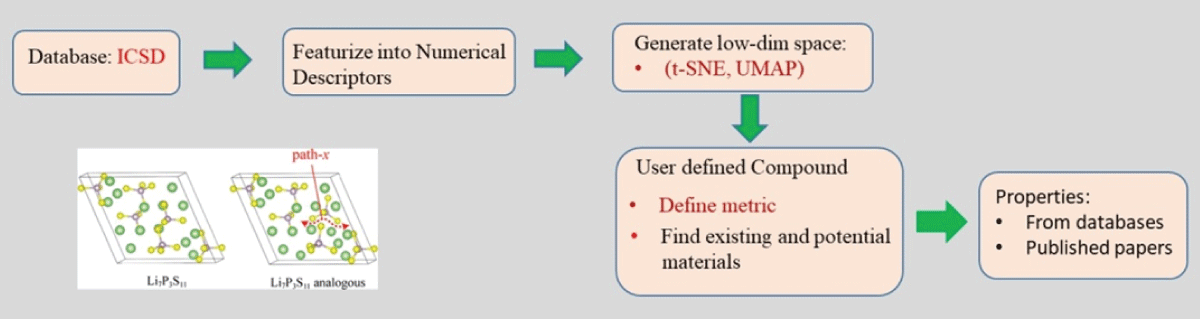
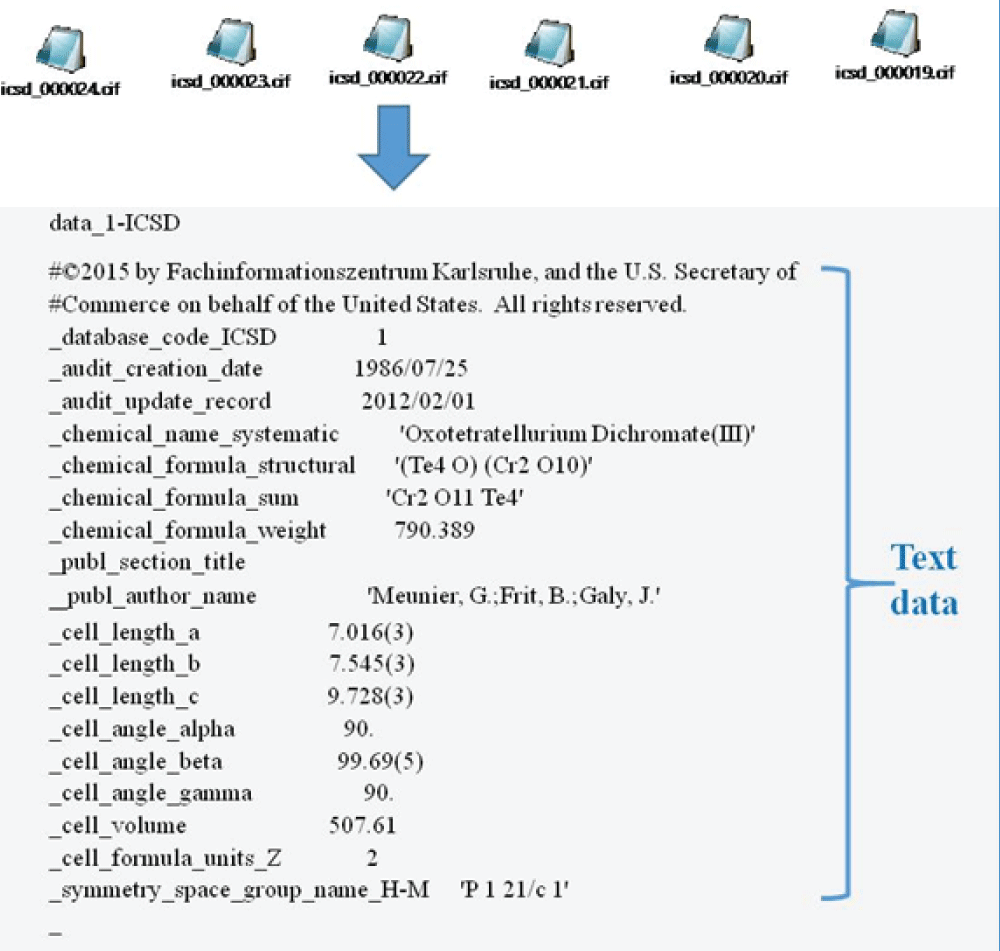
The overall approach has been schematically shown in Figure 1. Mapping of atomistic materials into feature vectors is an important step before the implementation of machine learning. To implement machine learning, thousands of crystallographic information files (CIF) need to be featurized into numerical descriptors using different featurization methods. Note that the CIF file is generally an unstructured, textual file containing information about crystal structure, such as lattice parameter, volume, and symmetry group (Figure 2). Several featurization methods are available, for example, Orbital, Jervish, SineMatrix, etc. In the present work, we use the SineMatrix method [77Faber F, Lindmaa A, von Lilienfeld OA, Armiento R. Crystal structure representation for machine learning models of formation energies. arXiv. 2015 Mar;1503.07406v1.] to featurize CIF files into numerical descriptors. As the featurized dataset is sparse and high-dimensional, we apply principal component analysis and use metrics and information criteria to choose the three-dimensional embedded space of materials over the two-dimensional embedded space in order to visualize and discover materials around the user-defined compound. In this research work, we select a Li-based cathodic compound with high energy density, NCM: Co0.33Li1.0Mn0.33Ni0.33O2, as a user-defined compound.
Figure 1: A schematic diagram showing the overall approach for discovering novel materials.
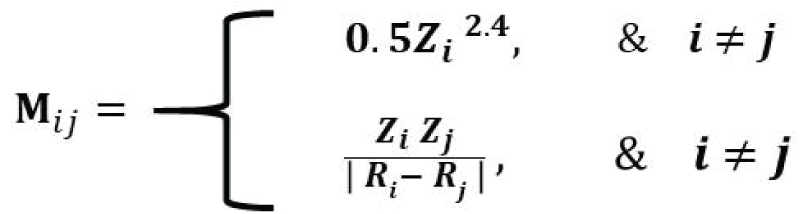
The SineMatrix is a modification of the Coulomb matrix, which estimates atomic interaction between a pair of atoms and is computationally less intensive. The ijth element of a Coulomb matrix is mathematically defined as [77Faber F, Lindmaa A, von Lilienfeld OA, Armiento R. Crystal structure representation for machine learning models of formation energies. arXiv. 2015 Mar;1503.07406v1.]:
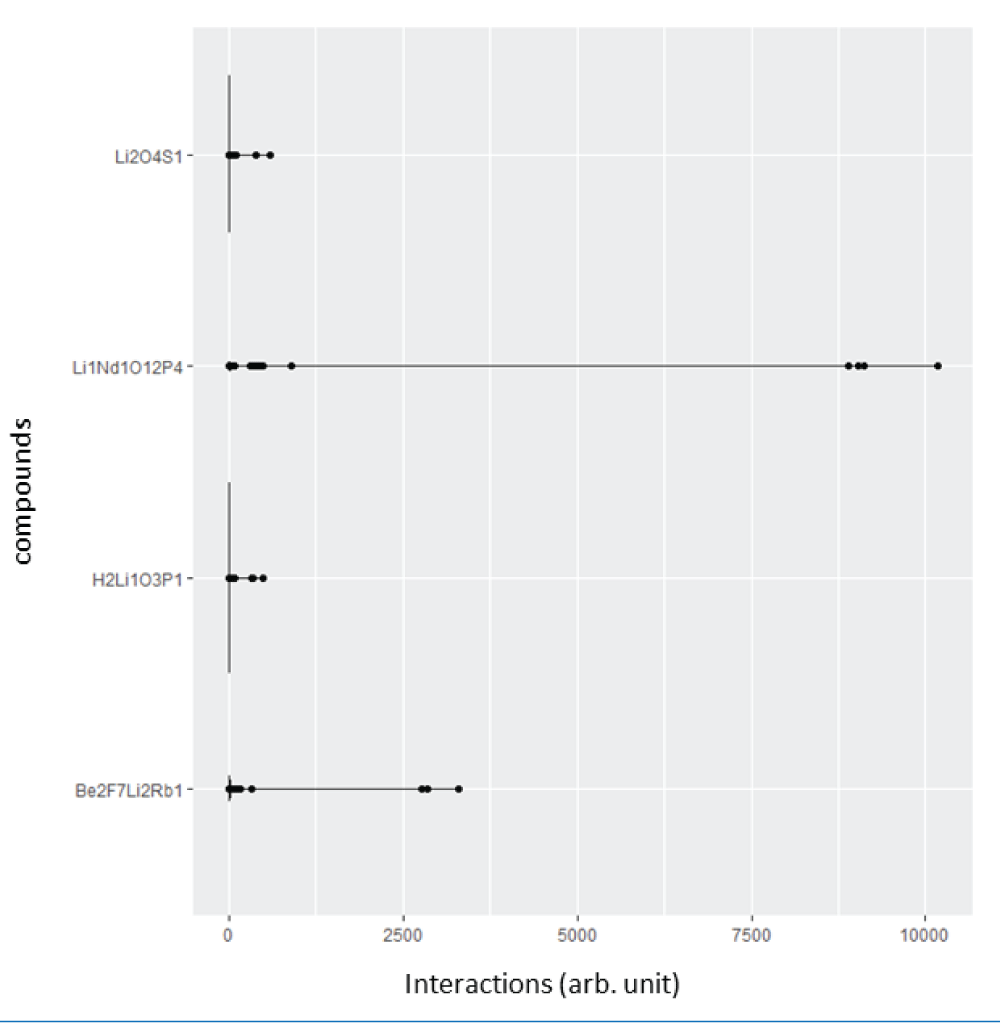
where the diagonal elements are proportional to the atomic number to the power 2.4, and the off-diagonal elements are the ratio of the product of atomic numbers and the Euclidean distance between the atomic positions of the ith atom and the jth atom. The diagonal elements of SineMatrix are the same as those of the Coulomb matrix. On the other hand, the off-diagonal elements are quite different [77Faber F, Lindmaa A, von Lilienfeld OA, Armiento R. Crystal structure representation for machine learning models of formation energies. arXiv. 2015 Mar;1503.07406v1.]. We extracted 8069 Li-based good CIF files from the ICSD database, generated 4680 features (dimensions) using the SineMatrix method, and created a high-dimensional dataset of size 8069 by 4680. Furthermore, each observation stems from the atomic interaction between a pair of atoms of a compound. The distribution of atomic interactions of the first four observations for four compounds, H2Li1O3P1, Li1Nd1O12P4, Be2F7Li2Rb, and Li2O4S1, respectively, is given in Figure 3. We observed that the off-diagonal elements of the SineMatrix for all compounds are mostly zero, suggesting the featurized dataset obtained from the SineMatrix is a sparse dataset. One of the diagonal elements for the crystal, Li1Nd1O12P4, is very high (>10000) as the atomic number for Nd is very high, and the atomic interaction for (Nd, Nd), therefore, would be very high. For Be2F7Li2Rb, Li2O4S1, and H2Li1O3P1, the maximum diagonal elements are relatively small, around 3700, 598, and 493, respectively.
Figure 2: Crystallographic information files (CIFs) showing the information on the crystal structure of different compounds.
Figure 3: Plot showing atomic interaction values of the featurized dataset obtained using the SineMatrix method for four compounds, H2Li1O3P1, Li1Nd1O12P4, Be2F7Li2Rb1 and Li2O4S1. Note that the interaction values are considerably greater for the Li1Nd1O12P4 compound due to Nd.
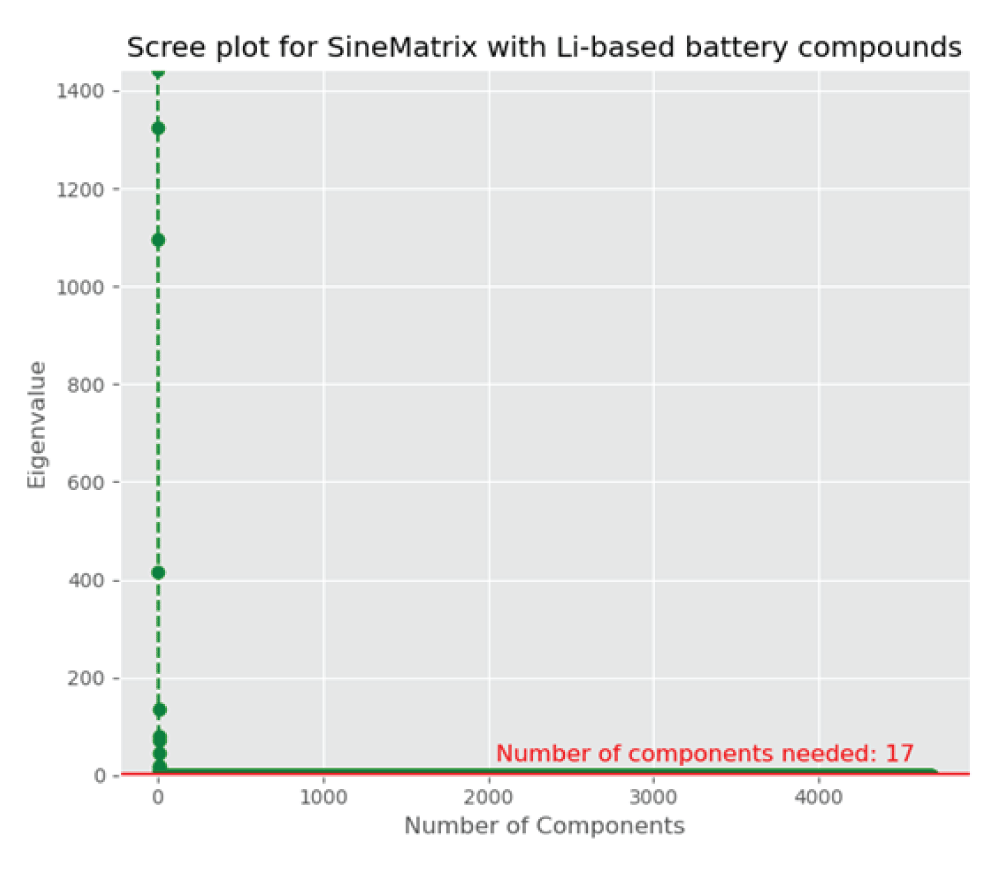
As the featurized dataset is high-dimensional and sparse, we initially reduce the dimension using principal component analysis (PCA), a linear unsupervised dimensionality reduction technique [88Hastie T, Tibshirani R, Friedman J. The elements of statistical learning: data mining, inference, and prediction. 2nd ed. New York: Springer; 2011. (Springer Series in Statistics).-1111Gentle JE. Statistics and computing: elements of computational statistics. New York: Springer; 2002.], and then implement the information criteria technique to compare the models obtained from the PCA to decide how many components are required for approximating the high-dimensional space into the lower-dimensional space, two or three dimensions, to visualize materials around the user-defined compound. Here, the featurized dataset, X, generated from the SineMatrix method has columns, Xi € R4680, i = 1, …, 8069, with the variance-covariance matrix, ∑, where ∑ is a 4680 × 4680 matrix. The PCA utilizes the eigenvalue decomposition of ∑ to find the principal components and partitions the total variability of the dataset, X, into the largest amount of variance that is explained by the first principal component, Y1, and the next largest amount of variance that is explained by the second principal component, Y2. The first and the second principal components are linear combinations of columns of X. The Scree plot (Figure 4) suggests that the optimal number of components is 17, which accounts for 99.9% of the total variance in the original variables. The first two components account for 59.1% of the total variability in the original variables, and the first three components explain around 83% of the total variance in the original features, and thus, three components are more effective compared to two components to visualize and investigate materials.
Figure 4: A scree plot showing each component’s eigenvalue with the number of components. It levels off after 17 components.
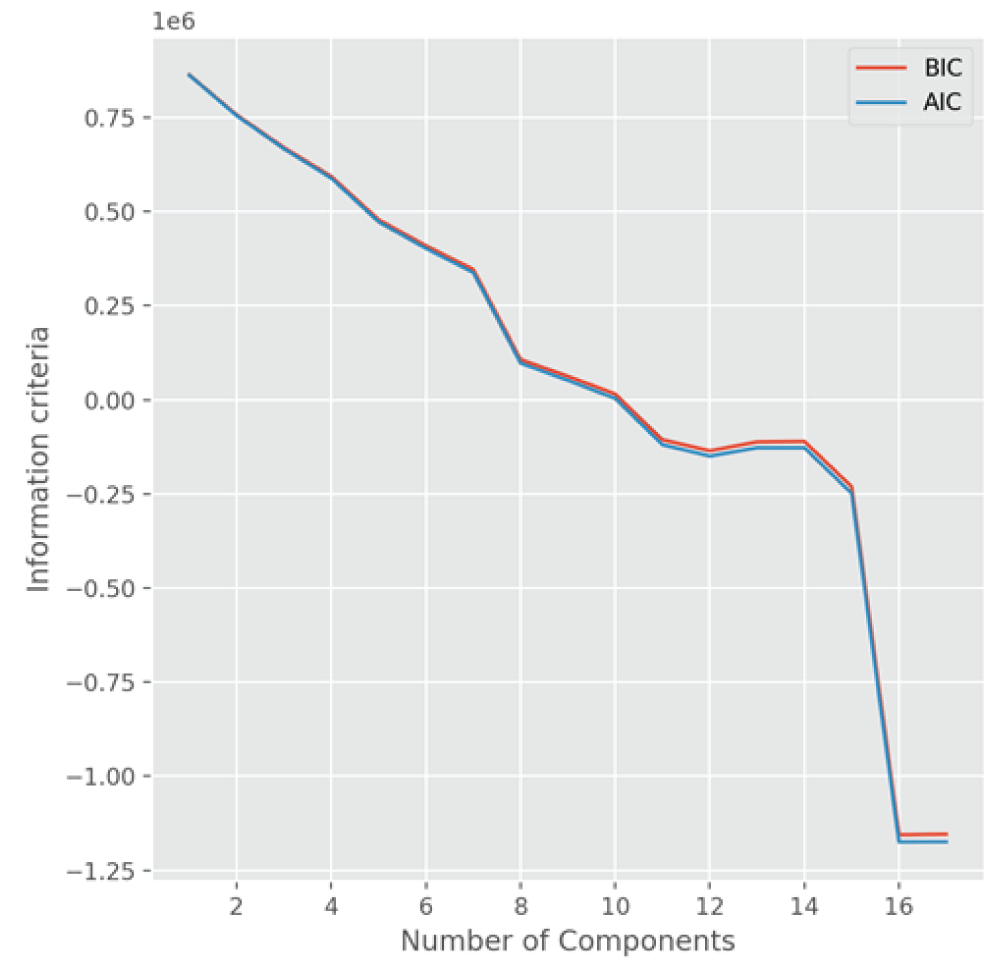
To compare the models obtained from the PCA, we also utilize the information criteria, Akaike information criterion (AIC) and Bayesian information criterion (BIC) [1212Goswami S, Wegman EJ. Detection of excessive activities in time series of graphs. J Appl Stat. 2020;47(1):176‑200.,1313Goswami S. Influential nodes and anomalous topic activities in social networks using multivariate time series and topic modeling. Commun Stat Theory Methods. 2020;51:1‑26.] to select the number of components for visualization of materials and material discovery. Figure 5 shows the plots of two information criteria, AIC and BIC, as a function of components. The minimum information criterion occurs when the number of components is around 17, which is consistent with the scree plot of eigenvalues explained by the component number. Both the AIC and BIC are smaller for the number of components = 3, as compared to the number of components = 2. Therefore, we conclude from these two methods, the PCA and the information criterion technique, that the 3D mappings of materials are better than the 2D mappings of materials, and better approximate the high-dimensional input space of materials.
Figure 5: A plot showing the information criteria, AIC and BIC, for the PCA model fitted to the 4680-dimensional featurized dataset obtained from Sine Matrix as a function of the number of components. The AIC and BIC values are minimum when the number of components is 17.
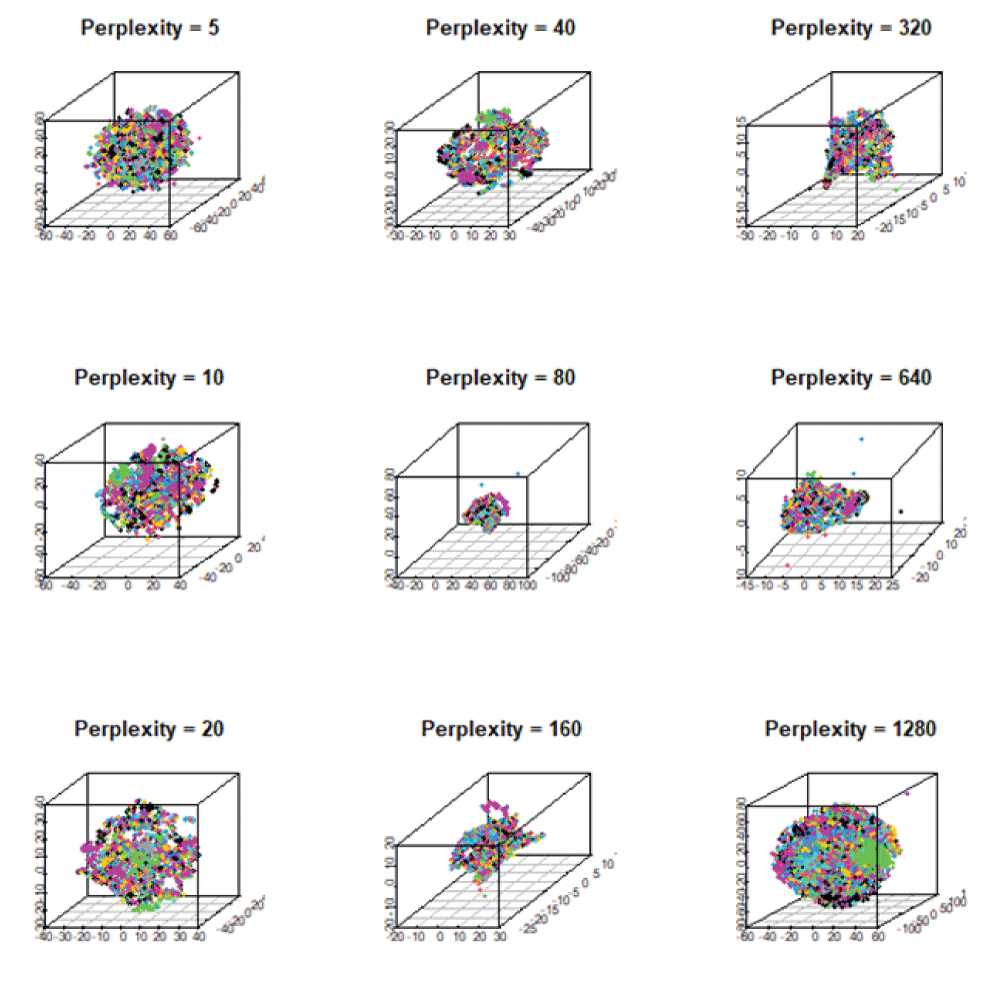
As atomic interactions are non-linear, we employ here two non-linear dimensionality reduction techniques, t-Stochastic Neighborhood Embedding (t-SNE) and Uniform Manifold Approximation and Projection (UMAP) [1414McInnes L, Healy J, Melville J. UMAP: uniform manifold approximation and projection for dimension reduction. arXiv. 2020 Sep;1802.03426v3 [stat.ML].] for 3D representation. The t-SNE preserves the local data structure while approximating the high-dimensional embedding into the low-dimensional embedding at moderate perplexity. In fact, it uses a metric, the Euclidean distance, that measures similarity between a pair of data points, xi and xj. This similarity follows a Gaussian distribution in the high-dimensional space and a Student's t-distribution in low-dimensional space. We vary the hyperparameter perplexity to observe different embeddings of the dataset. Figure 6 shows the variation of perplexity in the 3D embedding produced by the t-SNE. In fact, each 3D plot yields different embeddings of materials. For small values of perplexity between 5 and 20, data points unite together, thus generating small clusters. For larger perplexity, however, small clusters combine together and form bigger clusters, suggesting small to medium perplexity would be suitable for neighborhood analysis of materials.
Figure 6: The 3D mappings of materials obtained from t-SNE showing the variation of its hyperparameter, perplexity, ranging from 5 to 1280. They exhibit similar local data structure for perplexity 5, 10, 20, and 40. As perplexity increases, materials are clustered together to form a large component.
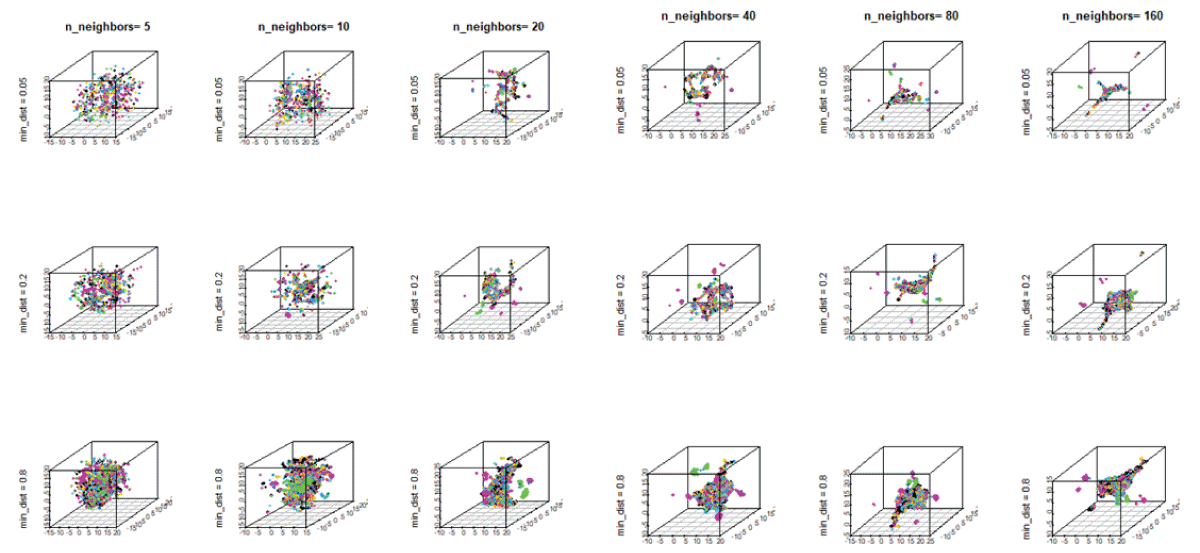
On the other hand, the UMAP method captures the global data structure and utilizes a metric, d (xi, xj), that measures similarity between a pair of data points, xi and xj. In this case, the similarity follows an exponential distribution in high-dimensional space. For the UMAP, we vary the hyperparameters, the number of neighbors, n_neighbors, and the distance between neighboring points, min-dist. Figure 7 shows different 3D plots with the variation of the hyperparameters, n-neighbors, and min-dist. We observe different embeddings of materials, exhibiting the presence of both clustered and spurious structure for n-neighbors, 40, 80, and 160. As the distance between neighboring points increases, one could observe the presence of a more tightly clustered structure. Thus, for materials discovery, the UMAP with n-neighbors up to 10 and the min-dist = 0.2 would be reasonable for neighborhood analysis of materials.
Figure 7: The 3D mappings of materials showing the configurations with the variation of UMAP hyperparameters, n_neighbors, ranging from 5 to 160, and min-dist, ranging from 0.05 to 0.8.
This study overcomes the critical challenge of projection mismatch in machine learning-driven materials discovery by implementing a robust, two-tier dimensionality reduction framework. By first extracting 17 principal components, we capture the global variance of the high-dimensional data while eliminating noise and feature redundancy. Subsequently, we map these features into an optimized 3D discovery space that mathematically minimizes local neighborhood distortion. This ensures that quantitative L2-norm similarity searches enable the reliable identification of novel Li-based candidate materials with experimentally validated functional properties.
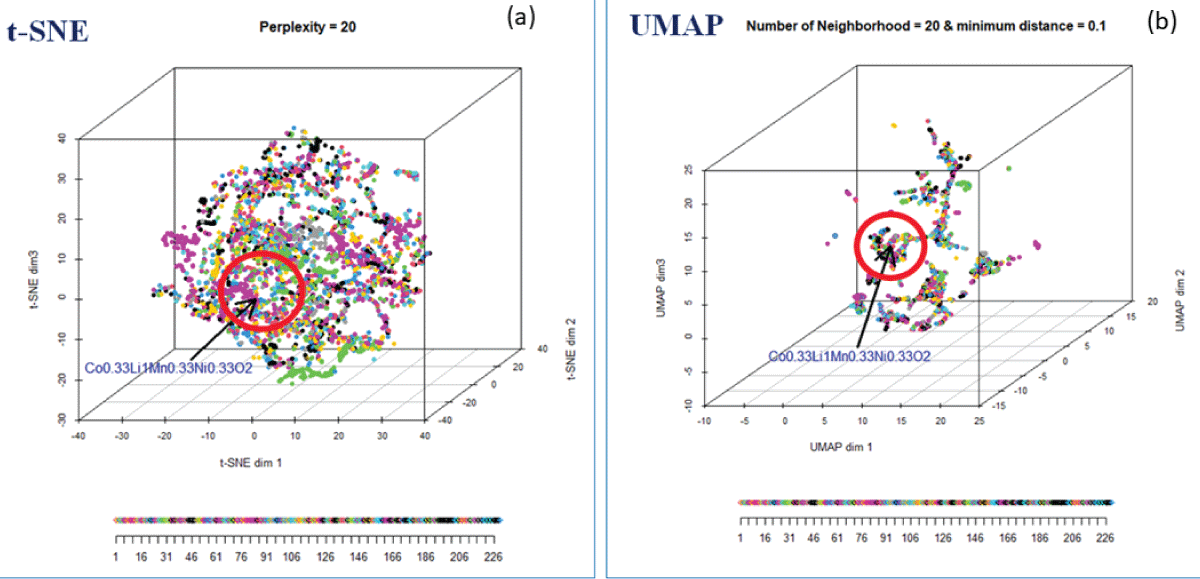
We choose t-SNE with perplexity = 20 over UMAP to identify the neighborhood around the user-defined compound, as it captures more within-cluster similarity among materials. Figure 8 (a) shows the 3D map of materials using the t-SNE for perplexity 20. Each dot (data point) in the 3D map represents a compound. In the map, data points are color-coded based on the symmetry group, ranging from 1 to 230. The user-defined compound, NCM (Co0.33Li1.0 Mn0.35Ni0.33O2), has been indicated by a red dot, and the nearest neighborhood of NCM is indicated by the red sphere. These compounds inside the red sphere are closer to the user-defined compound, NCM, and will, therefore, have similar characteristics to the user-defined compound, NCM. Several distance metrics, L1 norm, L2 norm, L-infinity norm, Canberra distance, distances based on angular separation, and correlation-based distances are available in N-dimensional space [1111Gentle JE. Statistics and computing: elements of computational statistics. New York: Springer; 2002.] for creating the neighborhood. The 3D map of materials using UMAP is shown in Figure 8(b).
Figure 8: (a) The 3D mapping of materials using t-SNE for perplexity = 20, color-coded with space group. (b) The 3D mapping of materials using UMAP.
The input dataset, X = {X1, X2, …, XN},is a metric space with a metric, d, such that the neighborhood, nbd, of the user-defined materials is defined as:
nbd [ f; X] = {g ϵ RN: d (f, g) = ‖ f-g ‖2 = (∑ Ni = 1 (x i -yi)2)1/2 ϵ R ≥ 0},
where f = {x1, x2, …, xN} and g = {y1, y2, …, yN} represent the user-defined compound and any other compound, respectively, in the N-dimensional space. To quantify the distortion introduced when mapping high-dimensional materials data to a lower-dimensional embedding, we define the projection mismatch (M) based on the preservation of local neighborhoods. Let X = {x1, x2,…,xN} ⊂ RD represent the original high-dimensional dataset, and Y = {y1,y2,…,yN} ⊂ Rd (where d ≪ D) represent its low-dimensional projection. For a user-defined reference compound i, we define its k-nearest neighborhood in the high-dimensional space as NkD(i) and in the projected low-dimensional space as Nkd(i). The local neighborhood mismatch Mi(k) is defined as: Mi(k)=1− (k∣NkD(i)∩Nkd(i)∣)/k, where ∣NkD(i)∩Nkd(i)∣ denotes the cardinality (number of shared compounds) of the intersection between the high-dimensional and low-dimensional neighborhoods. k is the user-defined neighborhood size. Mi(k) ∈ [11Kim HJ, Krishna TNV, Zeb K, Rajangam V, Gopi CVVM, Sambasivam S, Raghavendra KVG, Obaidat IM. A comprehensive review of Li-ion battery materials and their recycling techniques. Electronics (Basel). 2020 Jul.] represents the proportion of neighbors lost due to projection distortion. Here are the steps for calculation, I. Compute pairwise Euclidean distances, dD (xi, xj) = (∣xi−xj∣2)1/2, in the original space to obtain a high-dimensional distance matrix, ii. Compute pairwise Euclidean distances, dd (yi, yj) = (∣yi−yj∣2)1/2, in the reduced space to get the projected distance matrix, iii. For a target compound i, identify the set of k nearest neighbors in both spaces by sorting distances for neighborhood extraction, iv. Find the overlapping elements for intersection evaluation, and v. Calculate the target mismatch for mismatch computation.
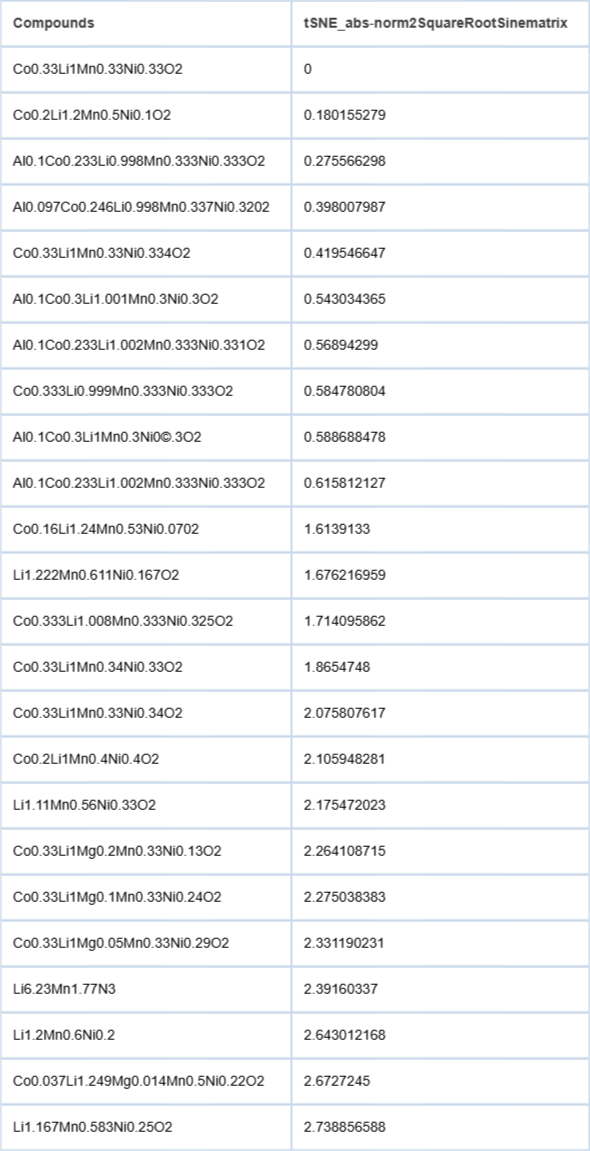
Following the dimensionality analysis, the local chemical environment around the user-defined compound (NCM) was explored by identifying its 100 nearest neighbors using t-SNE in the optimized 3D space. This 3D representation was chosen as it significantly reduces the projection mismatch to 15% compared to 40% in 2D, a finding consistent with our PCA-based information criteria analysis. The analysis successfully identified several novel materials with high potential, a selection of which is presented in Table 1. We generated the first 100 nearest neighbors of NCM in the reduced 3D space using t-SNE. A partial list of compounds in the neighborhood of NCM in the reduced 3D space is presented in Table 1. We observe that in 2D, the mismatch with high-dimensional (featured) data is 40% as compared to 15% in 3D, suggesting 3D would be more effective, consistent with the PCA results. Several novel compounds, such as Al0.1Co0.2Li1Mn0.3Ni0.3O2 (NCMA) Co0.04Li1.25Mg0.01Mn0.5Ni0.202 (NCMM), Co0.26Li1Mn 0.33Ni0.33Ru0.07 O2 (NCMR), Cr0.17Li1.28Mn0.56O2 (CMO), Li1.2Mn0.6 Ni0.2O2(NMO), Al0.1Li1Mn0.45Ni0.45O2 (NMOA), Li0.5Mn 0.9O2 (LMO), Co0.33Li1Mg0.33Mn0.34O2 (CMMO), Co0.07Li0.8Mn0.93 (CMO) have been identified within the close neighborhood of the user defined compound (Table 1).
Table 1: Nearest Neighbor Compounds and Distances Around NCM
Notably, the model identified Al₀.₁Co₀.₂Li₁Mn₀.₃Ni₀.₃O₂ (NCMA) in proximity to NCM. Given that nickel-cobalt-aluminum-oxide (NCA) has found commercial application in Tesla electric vehicles, our finding suggests that incorporating manganese to create NCMA is a promising direction for materials development. Furthermore, our approach validated its efficacy by identifying several established high-performance cathodes—such as lithium-cobalt-oxide (LCO), lithium-manganese-oxide (LMO), and NCA-within the NCM neighborhood. These compounds are known for high specific capacities, with experimental and theoretical values in the ranges of 140-210 mAh g⁻¹ and 225-450 mAh g⁻¹, respectively.
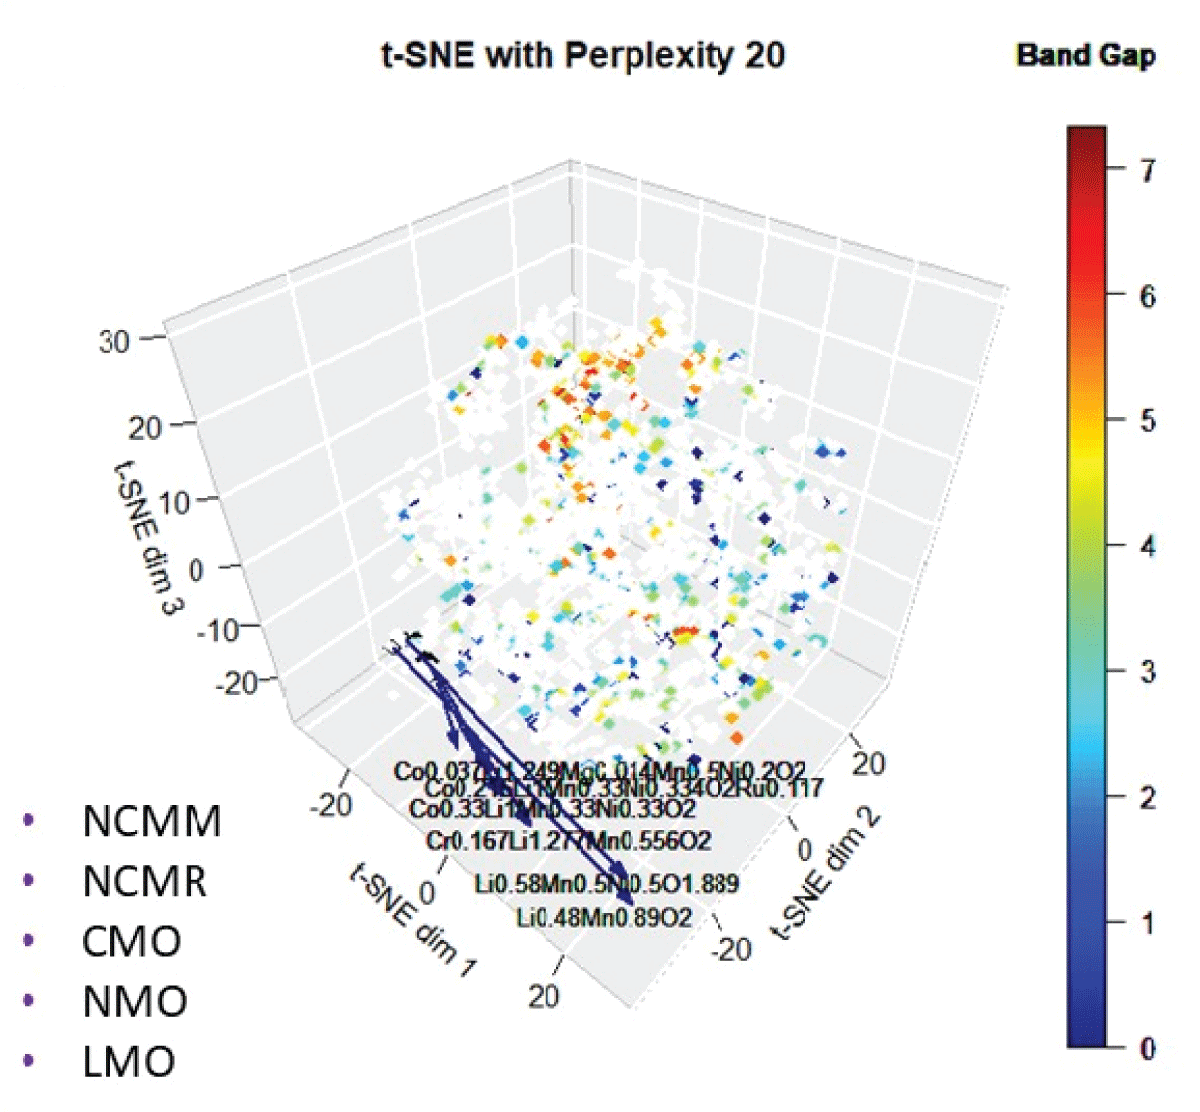
Another novel material, Ni-Mn-Li-oxide (NMO), has a similar energy density to the existing compound, LCO. In fact, several existing cathodic intercalated compounds, lithium-cobalt-oxide (LCO), lithium-manganese-oxide (LMO), and nickel-cobalt-aluminum-oxide (NCA), have higher specific capacity close to the user-defined compound [1515Nitta N, Wu F, Lee JT, Yushin G. Li‑ion battery materials: present and future. Mater Today. 2015;18.]. These Li-based cathodic intercalated compounds exhibit higher electrode potential against experimental and theoretical capacity. Some of the novel compounds discovered using this approach have been experimentally shown to have similar characteristics to the user-defined compound, suggesting this method is useful in detecting novel and potential compounds [1515Nitta N, Wu F, Lee JT, Yushin G. Li‑ion battery materials: present and future. Mater Today. 2015;18.]. Note that several similar compounds (Table 1) appear because of a small difference in stoichiometry. Many of the newly identified compounds, such as NCMM, NCMR, and CMO, also exhibit band gaps similar to the user-defined compound (Figure 9), further indicating their potential as functional analogues. The successful identification of materials that have been experimentally validated confirms that this methodology is a highly effective tool for discovering novel and promising compounds based on subtle distinctions in stoichiometry.
Figure 9: The 3D mapping of materials using t-SNE color-coded with bandgap.
Current machine learning (ML) approaches for materials discovery often associated with arbitrary two-dimensional (2D) projections of high-dimensional data. This practice inherently suffers from severe information loss and projection mismatch, leading to distorted local neighborhoods and suboptimal candidate selection. The primary scientific novelty of this work lies in departing from low-dimensional assumptions by introducing a data-driven statistical framework that determines the optimal embedding dimensionality. By integrating information criteria with unsupervised learning algorithms, our approach systematically mitigates the distortions inherent in standard ML projections. Applying this novel methodology to thousands of Li-based compounds, we demonstrated that an optimized 3D representation preserves the local neighborhood of a user-defined reference compound with significantly higher fidelity than conventional 2D maps. Leveraging the L2 norm as a dissimilarity metric, we successfully identified nine novel candidate materials. The validity and predictive power of this approach were confirmed as several of these candidates have been experimentally shown to share key functional characteristics, such as comparable band gaps and specific capacities with the reference material. Ultimately, this study establishes a unique, statistical framework that outperforms traditional 2D ML screening, providing a highly reliable pathway for accelerating the discovery of novel, functional materials.
The mathematical proximity in our latent feature space is a necessary but not sufficient condition for guaranteed battery performance. Here we utilize Sinematrix for featurization, which primarily captures Coulomb interactions between atoms. While this successfully filters out non-viable candidates, it represents a simplified abstraction of real-world battery environments. Other descriptors, such as angular and radial distribution function and dihedral angle distribution function, can be used for featurization. Consequently, our workflow is positioned as an accelerated screening tool designed to drastically reduce the candidate search space from thousands to a few high-viability bulk structures, which must then be subjected to DFT calculations and experimental validation to resolve these complex multi-scale behaviors.
This work addresses a critical challenge in machine learning-driven materials discovery: the information loss and projection mismatch that occur when mapping high-dimensional materials data to conventional 2D space. To overcome this, we presented a robust statistical framework that integrates information criteria with unsupervised learning algorithms to determine the optimal embedding dimensionality for a given dataset. Applying this methodology to thousands of Li-based compounds, we demonstrated that a 3D representation preserves the local neighborhood of a user-defined compound with significantly higher fidelity than a 2D map. Using the L2 norm as a dissimilarity metric within this optimized 3D space, we successfully identified nine novel candidate materials. The validity of our approach was confirmed as several of these compounds have been experimentally shown to share key characteristics, such as similar band gaps, with the reference material. This study establishes a more reliable and systematic approach for discovering novel, functional materials by mitigating the distortions inherent in arbitrary low-dimensional projections.
Kim HJ, Krishna TNV, Zeb K, Rajangam V, Gopi CVVM, Sambasivam S, Raghavendra KVG, Obaidat IM. A comprehensive review of Li-ion battery materials and their recycling techniques. Electronics (Basel). 2020 Jul.
Kim S, Hegde VI, Yao Z, Lu Z, Amsler M, He J, Hao S, Croy JR, Lee E, Thackeray MM, Wolverton C. First principles study of lithium cobalt spinel oxides: correlating structure and electrochemistry. ACS Appl Mater Interfaces. 2018;10:13479‑13490.
Weston L, Stampfl C. Machine learning the band gap properties of kesterite I2‑II‑IV‑V4 quaternary compounds for photovoltaics applications. Phys Rev Mater. 2018;2:085407.
Ward L, et al. Matminer: an open‑source toolkit for materials data mining. Comput Mater Sci. 2018;152:60‑69.
Wegman E. Lecture notes: geometric methods in statistics. Fairfax (VA): George Mason Univ; 2016.
Chen B, et al. Mapping materials and molecules. Acc Chem Res. 2020;53:1981‑1991.
Faber F, Lindmaa A, von Lilienfeld OA, Armiento R. Crystal structure representation for machine learning models of formation energies. arXiv. 2015 Mar;1503.07406v1.
Hastie T, Tibshirani R, Friedman J. The elements of statistical learning: data mining, inference, and prediction. 2nd ed. New York: Springer; 2011. (Springer Series in Statistics).
James G, Witten D, Hastie T, Tibshirani R. An introduction to statistical learning with applications in R. New York: Springer; 2013. (Springer Series in Statistics).
Goswami S, Wegman EJ. Comparison of different classification methods on glass identification for forensic research. J Stat Sci Appl. 2016;4:65‑84.
Gentle JE. Statistics and computing: elements of computational statistics. New York: Springer; 2002.
Goswami S, Wegman EJ. Detection of excessive activities in time series of graphs. J Appl Stat. 2020;47(1):176‑200.
Goswami S. Influential nodes and anomalous topic activities in social networks using multivariate time series and topic modeling. Commun Stat Theory Methods. 2020;51:1‑26.
McInnes L, Healy J, Melville J. UMAP: uniform manifold approximation and projection for dimension reduction. arXiv. 2020 Sep;1802.03426v3 [stat.ML].
Nitta N, Wu F, Lee JT, Yushin G. Li‑ion battery materials: present and future. Mater Today. 2015;18.
1Computational and Data Sciences (CDS), George Mason University, Fairfax, VA, USA
2US Naval Research Laboratory, Washington, DC, 20375 USA
Address Correspondence: Syed B Quadri, US Naval Research Laboratory, Washington DC, 20375 USA, Email: [email protected]
How to cite this article: Goswami S, Quadri SB. Machine Learning-Driven Discovery of Novel Lithium-Based Battery Materials. IgMin Res. June 22, 2026; 4(6): 215-221. IgMin ID: igmin346; DOI:10.61927/igmin346; Available at: igmin.link/p346
Figure 1: A schematic diagram showing the overall approach f...
Figure 2: Crystallographic information files (CIFs) showing ...
Figure 3: Plot showing atomic interaction values of the feat...
Figure 4: A scree plot showing each component’s eigenvalue...
Figure 5: A plot showing the information criteria, AIC and B...
Figure 6: The 3D mappings of materials obtained from t-SNE s...
Figure 7: The 3D mappings of materials showing the configura...
Figure 8: (a) The 3D mapping of materials using t-SNE for pe...
Figure 9: The 3D mapping of materials using t-SNE color-code...
: ...
Table 1: Nearest Neighbor Compounds and Distances Around NC...
Kim HJ, Krishna TNV, Zeb K, Rajangam V, Gopi CVVM, Sambasivam S, Raghavendra KVG, Obaidat IM. A comprehensive review of Li-ion battery materials and their recycling techniques. Electronics (Basel). 2020 Jul.
Kim S, Hegde VI, Yao Z, Lu Z, Amsler M, He J, Hao S, Croy JR, Lee E, Thackeray MM, Wolverton C. First principles study of lithium cobalt spinel oxides: correlating structure and electrochemistry. ACS Appl Mater Interfaces. 2018;10:13479‑13490.
Weston L, Stampfl C. Machine learning the band gap properties of kesterite I2‑II‑IV‑V4 quaternary compounds for photovoltaics applications. Phys Rev Mater. 2018;2:085407.
Ward L, et al. Matminer: an open‑source toolkit for materials data mining. Comput Mater Sci. 2018;152:60‑69.
Wegman E. Lecture notes: geometric methods in statistics. Fairfax (VA): George Mason Univ; 2016.
Chen B, et al. Mapping materials and molecules. Acc Chem Res. 2020;53:1981‑1991.
Faber F, Lindmaa A, von Lilienfeld OA, Armiento R. Crystal structure representation for machine learning models of formation energies. arXiv. 2015 Mar;1503.07406v1.
Hastie T, Tibshirani R, Friedman J. The elements of statistical learning: data mining, inference, and prediction. 2nd ed. New York: Springer; 2011. (Springer Series in Statistics).
James G, Witten D, Hastie T, Tibshirani R. An introduction to statistical learning with applications in R. New York: Springer; 2013. (Springer Series in Statistics).
Goswami S, Wegman EJ. Comparison of different classification methods on glass identification for forensic research. J Stat Sci Appl. 2016;4:65‑84.
Gentle JE. Statistics and computing: elements of computational statistics. New York: Springer; 2002.
Goswami S, Wegman EJ. Detection of excessive activities in time series of graphs. J Appl Stat. 2020;47(1):176‑200.
Goswami S. Influential nodes and anomalous topic activities in social networks using multivariate time series and topic modeling. Commun Stat Theory Methods. 2020;51:1‑26.
McInnes L, Healy J, Melville J. UMAP: uniform manifold approximation and projection for dimension reduction. arXiv. 2020 Sep;1802.03426v3 [stat.ML].
Nitta N, Wu F, Lee JT, Yushin G. Li‑ion battery materials: present and future. Mater Today. 2015;18.


 スキャンしてリンクを取得